Compare molecular and crystal structures
Introduction
This page contains a set of examples that shows how to compare molecular and crystal structures using critic2.
There are different comparison methods available, depending on whether molecules or crystals are being compared but, in general, they all render a numerical value for the similarity of a chosen pair of structures, and it is up to the user to then decide whether the structures are considered “the same” or “different” for the given similarity value. The interface to the comparison methods is the COMPARE keyword in general and COMPAREVC for comparisons between crystal structures allowing for cell distortions. We focus on COMPARE for now.
The simplest way to use the COMPARE keyword is to simply list the structures after the keyword:
COMPARE file1.xyz file2.cif file3.in . file4.out
where any of the formats supported by critic2
are allowed and . represents the system that has been loaded by a
previous CRYSTAL or
MOLECULE command.
Comparing Molecules
Atoms are in the Same Order
There are several different ways of comparing molecules. The most
important point to note about molecular comparison is whether the atomic
sequence is the same in all the structures being compared, that is, if
the atoms and their coordinates as they appear in the corresponding
structure files can be assumed to be in the same order. If this is the
case, then the comparison is much simpler and you should use the
SORTED keyword. For instance, the HIS_TYR_HIS molecule in the
example contains a tripeptide from the
PEPCONF library. The three
variants of this structure are:
-
HIS_TYR_HIS_0.xyz: the original structure calculated at the LC-wPBE-XDM/aug-cc-pVTZ level of theory. -
HIS_TYR_HIS_0-rattle.xyz: the same structure with a 0.02 standard deviation rattle imposed using ASE. -
HIS_TYR_HIS_0-sto3g.xyz: the same structure after relaxation with B3LYP/STO-3G.
(The choice of xyz as the format for these files is immaterial; any
format accepted by critic2 can be used.)
Neither the rattle nor the geometry relaxation alter the order of the
atoms in this molecule, and therefore the comparison can be carried
out assuming the atomic sequence is the same, with:
compare sorted HIS_TYR_HIS_0-sto3g.xyz HIS_TYR_HIS_0-rattle.xyz HIS_TYR_HIS_0.xyz
For a given pair of molecules, the comparison is carried out by translating the centers of mass of both molecules to the origin and then finding the rotation that brings one of them in closest agreement with the other in the least-squares sense. The output is:
* COMPARE: compare structures
  Molecule 1 : HIS_TYR_HIS_0-sto3g.xyz
  Molecule 2 : HIS_TYR_HIS_0-rattle.xyz
  Molecule 3 : HIS_TYR_HIS_0.xyz
# Assuming the atom sequence is the same in all molecules.
# RMS of the atomic positions in bohr
   Molecule     HIS_TYR_HIS_0-sto3g.xyz HIS_TYR_HIS_0-rattle.xyz HIS_TYR_HIS_0.xyz
      RMS                     1               2               3
  HIS_TYR_HIS_0-sto3g.xyz   0.0000000       2.5006092       2.4935909
  HIS_TYR_HIS_0-rattle.xyz  2.5006092       0.0000000       0.0599950
  HIS_TYR_HIS_0.xyz         2.4935909       0.0599950       0.0000000
where the individual values represent the root-mean-square (RMS) of the deviations in the atomic positions in bohr (the units can be changed using the UNITS keyword). Note how the RMS is about 0.03 angstrom for the rattled structure, consistent with the rattling parameter used in ASE.
Atoms are not in the Same Order
The comparison problem becomes considerably trickier if the atomic sequences are not in the same order. Consider the structure:
HIS_TYR_HIS_0-shuf.xyz: the same structure asHIS_TYR_HIS_0-rattle.xyzbut with a random permutation applied on the atoms.
In this case, there are two options: either a method is applied to try to put the atoms in order or a comparison method is used for which the order of the atomic sequence is irrelevant. The recommended procedure is to use Ullmann’s graph matching algorithm, which is the default if no keywords are passed to COMPARE:
compare HIS_TYR_HIS_0-rattle.xyz HIS_TYR_HIS_0-shuf.xyz HIS_TYR_HIS_0.xyz
This method tries to match the molecular graph of one molecule onto the other based on the atomic connectivity by exploring all possible permutations, with tricks applied to shorten the search. Ullmann’s method can be expensive particularly for branching molecules with symmetric (in the molecular graph sense) substituents. Once the two atomic sequences are in the same order, the comparison proceeds as in the ordered case:
* COMPARE: compare structures
  Molecule 1 : HIS_TYR_HIS_0-rattle.xyz
  Molecule 2 : HIS_TYR_HIS_0-shuf.xyz
  Molecule 3 : HIS_TYR_HIS_0.xyz
# Using Ullmann's graph matching algorithm.
# RMS of the atomic positions in bohr
   Molecule     HIS_TYR_HIS_0-rattle.xyz HIS_TYR_HIS_0-shuf.xyz HIS_TYR_HIS_0.xyz
      RMS              1               2               3
  HIS_TYR_HIS_0-rattle.xyz  0.0000000       0.0000000       0.0599950
  HIS_TYR_HIS_0-shuf.xyz    0.0000000       0.0000000       0.0599950
  HIS_TYR_HIS_0.xyz         0.0599950       0.0599950       0.0000000
Note how the RMS between the rattled structure and the same structure with shuffled atoms is zero, and the RMS of both of them with the original structure is the same value as above.
Comparing Crystals
The recommended procedure for comparing crystal structures is to use their simulated powder diffraction patterns (see the POWDER keyword) and compare them using cross-correlation functions as described by A. Otero-de-la-Roza, J. Appl. Cryst. 57 (2024) 1401-1414. In this method, the powder diffractograms of the two crystals are calculated and the reflections and intensities represented as Gaussian functions. Unlike the molecular comparison, this method does not rely on the atoms being in the same order, so any two structures can be compared directly. In the provided example three structures are given:
-
uracil.cif: the uracil structure from the critic2 structure library. -
urea.cif: the urea structure from the critic2 structure library. -
urea-rattle.cif: the same urea structure but with a 0.02 standard deviation rattle imposed using ASE. -
urea-bigrattle.cif: the same urea structure but with a 1.0 standard deviation rattle imposed using ASE. This essentially destroys the molecular structure.
(The choice of cif as the format for these files is immaterial; any
format accepted by critic2 can be used.) To compare them, use:
compare urea.cif urea-rattle.cif urea-bigrattle.cif uracil.cif
and the result is:
* COMPARE: compare structures
  Crystal 1 : urea.cif
  Crystal 2 : urea-rattle.cif
  Crystal 3 : urea-bigrattle.cif
  Crystal 4 : uracil.cif
# Using cross-correlated Gaussian powder diffraction patterns (GPWDF).
# Please cite:
#   Otero-de-la-Roza, J. Appl. Cryst. 57 (2024) 1401-1414 (doi:10.1107/S1600576724007489)
# Two structures are exactly equal if DIFF = 0.
  ... calculating pattern 1 of 4.
  ... finished calculating patterns
  ... comparing pattern 1 of 4.
  ... finished comparing patterns
    Crystal        urea.cif     urea-rattle.cif urea-bigrattle.cif   uracil.cif
     DIFF              1               2               3               4
  urea.cif            0.0000000       0.0000247       0.2475299       0.9747396
  urea-rattle.cif     0.0000247       0.0000000       0.2459106       0.9747785
  urea-bigrattle.cif  0.2475299       0.2459106       0.0000000       0.9495606
  uracil.cif          0.9747396       0.9747785       0.9495606       0.0000000
The similarity index calculated by this method (their DIFF value) goes between 0 and 1, which 0 being a perfect match and 1 complete dissimilarity. Note how the small rattle gives a urea structure that is essentially coincident with the original, whereas a big rattle results in a much higher value, and the uracil and urea structures have nothing in common.
Determining Repeated and Unique Structures
An operation that is commonly carried out with the COMPARE keyword is to determine, from a (large) list of structures, which of them are unique and which are repeated. This can be easily accomplished with the REDUCE option to COMPARE, which works similar to normal COMPARE, but skips over structures that have already been determined to be equivalent to others in the list. For instance, if we wanted to compare a list of 50 very similar structures we would do:
COMPARE REDUCE 1e-6 str-001.POSCAR str-002.POSCAR str-003.POSCAR \
  str-004.POSCAR ...
This means that two of the crystal structures in the list are considered equal if the difference in their powder diffraction patterns is less than 1e-6, calculated as in the example above. The output of COMPARE/REDUCE contains the following parts. First, the powder diffraction difference values are reported:
   DIFF              1               2               3               4               5
str-001.POSCAR  not-calculated   0.0007887       0.0007503       0.0007503       0.0007887
str-002.POSCAR   0.0007887      not-calculated   0.0000703       0.0000703      not-calculated
str-003.POSCAR   0.0007503       0.0000703      not-calculated  not-calculated  not-calculated
str-004.POSCAR   0.0007503       0.0000703      not-calculated  not-calculated  not-calculated
...
where some of the difference values were not calculated, because some of the structures were determined to be equivalent to others at the requested level (i.e. their DIFF was lower than 1e-6). This cuts down the computational cost of the COMPARE/REDUCE calculation significantly. After this, the list of unique structures is listed:
+ List of unique structures (15):
1: str-001.POSCAR with multiplicity 1
2: str-002.POSCAR with multiplicity 4
3: str-003.POSCAR with multiplicity 7
6: str-006.POSCAR with multiplicity 3
...
where the “multiplicity” is the number of repeated structures in the original list corresponding to the given unique representative structure. Lastly, the repeated structures are listed, along with their unique representative from the list above:
+ List of repeated structures (34):
4: str-004.POSCAR same as 3: str-003.POSCAR
5: str-005.POSCAR same as 2: str-002.POSCAR
9: str-009.POSCAR same as 3: str-003.POSCAR
10: str-010.POSCAR same as 7: str-007.POSCAR
11: str-011.POSCAR same as 6: str-006.POSCAR
...
Comparing Two Crystals Allowing for Cell Distortions (COMPAREVC)
The variable-cell comparison method (COMPAREVC) is used to compare two crystal structures. It is similar to the plain powder-diffraction-based comparison method described above, but it is designed to produce a high similarity score (a low DIFF value) when one of the structures is a lattice distortion of the other with the same motif. This can happen, for instance, due to the effect of temperature or pressure, or when comparing a calculated structure with an experimental one.
COMPAREVC works by designating one of the structures as reference and the other as candidate. The list of reflection angles and intensities are calculated for both, and the similarity score is calculated (the DIFF value, same as in COMPARE). Then, the DIFF value is minimized as a function of the lattice parameters of the first structure, looking for the deformation that best matches the second structure. This process is facilitated by the fact that the mathematical dependence of DIFF with the lattice parameters of either structure is known analytically.
Finding the smallest DIFF value as a function of deformations is a global minimization problem. For this reason, COMPAREVC launches a series of optimization processes starting from different deformations around the initial structure of the first crystal. The lowest DIFF found during this exploration is the final COMPAREVC score. The process is described in detail in the corresponding article. Using COMPAREVC in this way requires compiling critic2 with access to the NLOPT library.
Because it involves several (many) powder diffraction generation and comparison steps, COMPAREVC is slower than the usual powder diffraction comparison and it should not be used unless lattice distortions are expected to play a role in the comparison. A DIFF value in the range of 0.05 or lower indicates considerable similarity and a probable match, although user discretion is recommended.
To compare two structures using this method, use the COMPAREVC keyword:
COMPAREVC xtal1.cif xtal2.cif
The output shows the structure that is being deformed (“Crystal 1”) and the structure used as the target of the comparison (“Crystal 2”), and each deformation considered together with the corresponding similarity score (DIFF). The global search continues until no decrease in the value of DIFF is found for a number of consecutive iterations (by default, 5000). The end result is the lattice parameters for the deformation of structure 1 that best matches structure 2, the change in volume, and the final similarity score (DIFF) from COMPAREVC. It is also possible to control the parameters for the global search (see the COMPAREVC entry in the manual). Note that, unlike COMPARE, COMPAREVC cannot be used to compare more than two structures at a time. Hence, if you want to compare a list of structures, you will need to repeat COMPAREVC as many times as necessary.
After the two crystals are compared, COMPAREVC can be used to write
the transformed structures that most resemble each other, that is, the
ones that generated the final DIFF score. This is done by using the
WRITE option:
COMPAREVC xtal1.cif xtal2.cif WRITE compare-final.res
which generates a .res file (compare-final.res) containing the
deformed structure 1. Any file format written by critic2 can be used
in the WRITE option. In addition, a second file is written
(compare-final.xy) with the diffraction pattern for this same
structure. The powder diffraction patterns
of the original structures can be generated and plotted for
visual comparison using the
POWDER command on the corresponding files.
Comparing a Crystal and an Experimental Powder Diffraction Pattern (COMPAREVC)
The same method implemented in COMPAREVC can be used to compare a crystal structure with an experimental powder diffraction pattern, even if the pattern is of very low quality. Using the variable-cell version of COMPARE for this is important because calculated and experimental powder patterns are seldom comparable, and one must take into account cell distortions caused by temperature, pressure, etc. The method is described in A. Otero-de-la-Roza, J. Appl. Cryst. 57 (2024) 1401-1414.
To use COMPAREVC, we must first extract the list of reflections (angles and intensities) from the experimental pattern. This is done using the XRPD keyword. First, we calculate the background of the experimental pattern:
XRPD BACKGROUND XXIX_PXRD_V4.xy background.xy
This generates a new file (background.xy) containing the background,
the original pattern, and the difference between them:
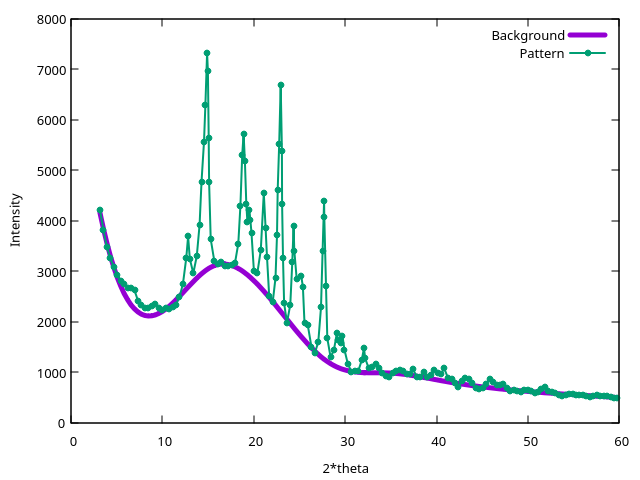
This pattern comes from the powder-assisted challength in the seventh blind test and it has been deliberately made low quality for the challenge.
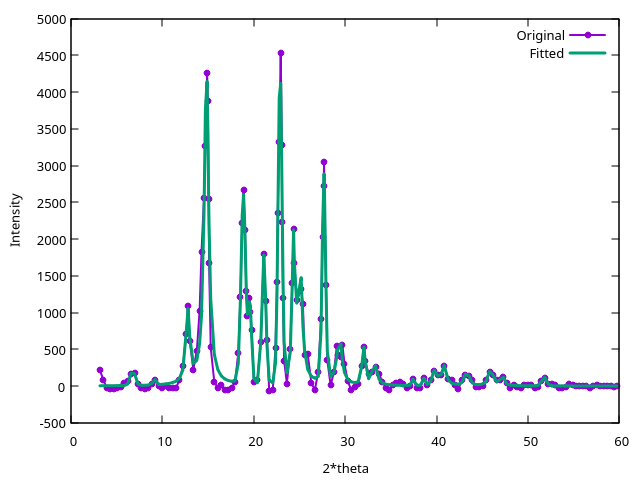
Next, we fit the background-subtracted pattern with a linear combination of peak functions:
XRPD FIT background.xy
This command generats two files. The compare.peaks file contains the
list of reflection angles and intensities, as well as other
information from the fit. The compare_fit.dat gives the original and
the fitted patterns, and plotting it is a good idea to examine if the
fit is accurate:
Although in this case it is not necessary, it is also possible to speed up the pattern fitting step (which may take up to several minutes in a more complex case) by passing to critic2 the intenstity below which peaks are considered random noise. For instance:
XRPD FIT background.xy 40
Lastly, we run the comparison of the crystal structure with the
experimental powder pattern represented by the .peaks file:
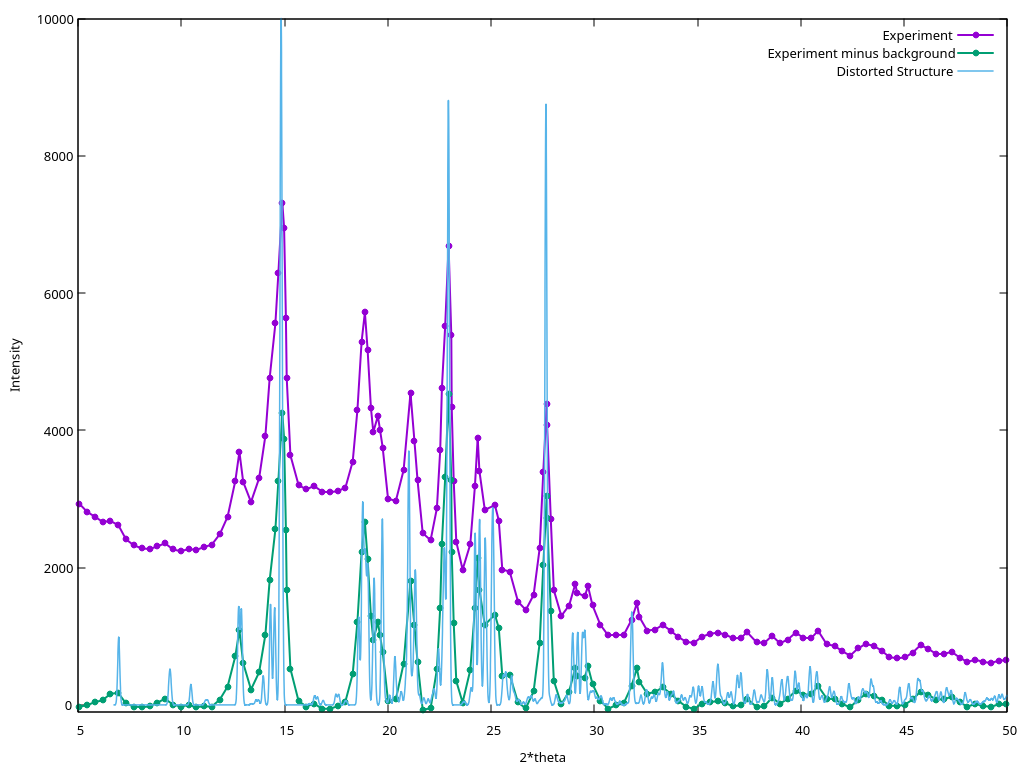
COMPAREVC expt_relaxed.cif compare.peaks WRITE compare-final.res
The output is:
+ SUCCESS? maximum number of evaluations reached
+ Lattice parameters:
  Initial (1): 46.12870009 18.72174805 17.34779191 90.000000  93.220800  90.000000
  Final (1):   47.93102211 19.00657572 17.87899276 90.622445  92.629913  89.438222
  Relative length deformations:   0.03907160  0.01521373  0.03062066
  Angle displacements:   0.6224  0.5909  0.5618
  Initial volume (bohr3): 14958.0602
  Final volume (bohr3): 16269.0233
  Volume deformation: 0.08764258
+ DIFF = 0.0918283964
The low 0.09 score indicates high similarity; much lower scores
(higher similarity) can be obtained if the patterns are of higher
quality. The WRITE keyword used in COMPAREVC is optional, and makes
COMPAREVC write two additional files. compare-final.res contains
the deformed structure 1 with the best match, and compare-final.xy
contains the powder diffraction pattern from the distorted structure:
Example Files Package
Files: example_13_01.tar.xz.